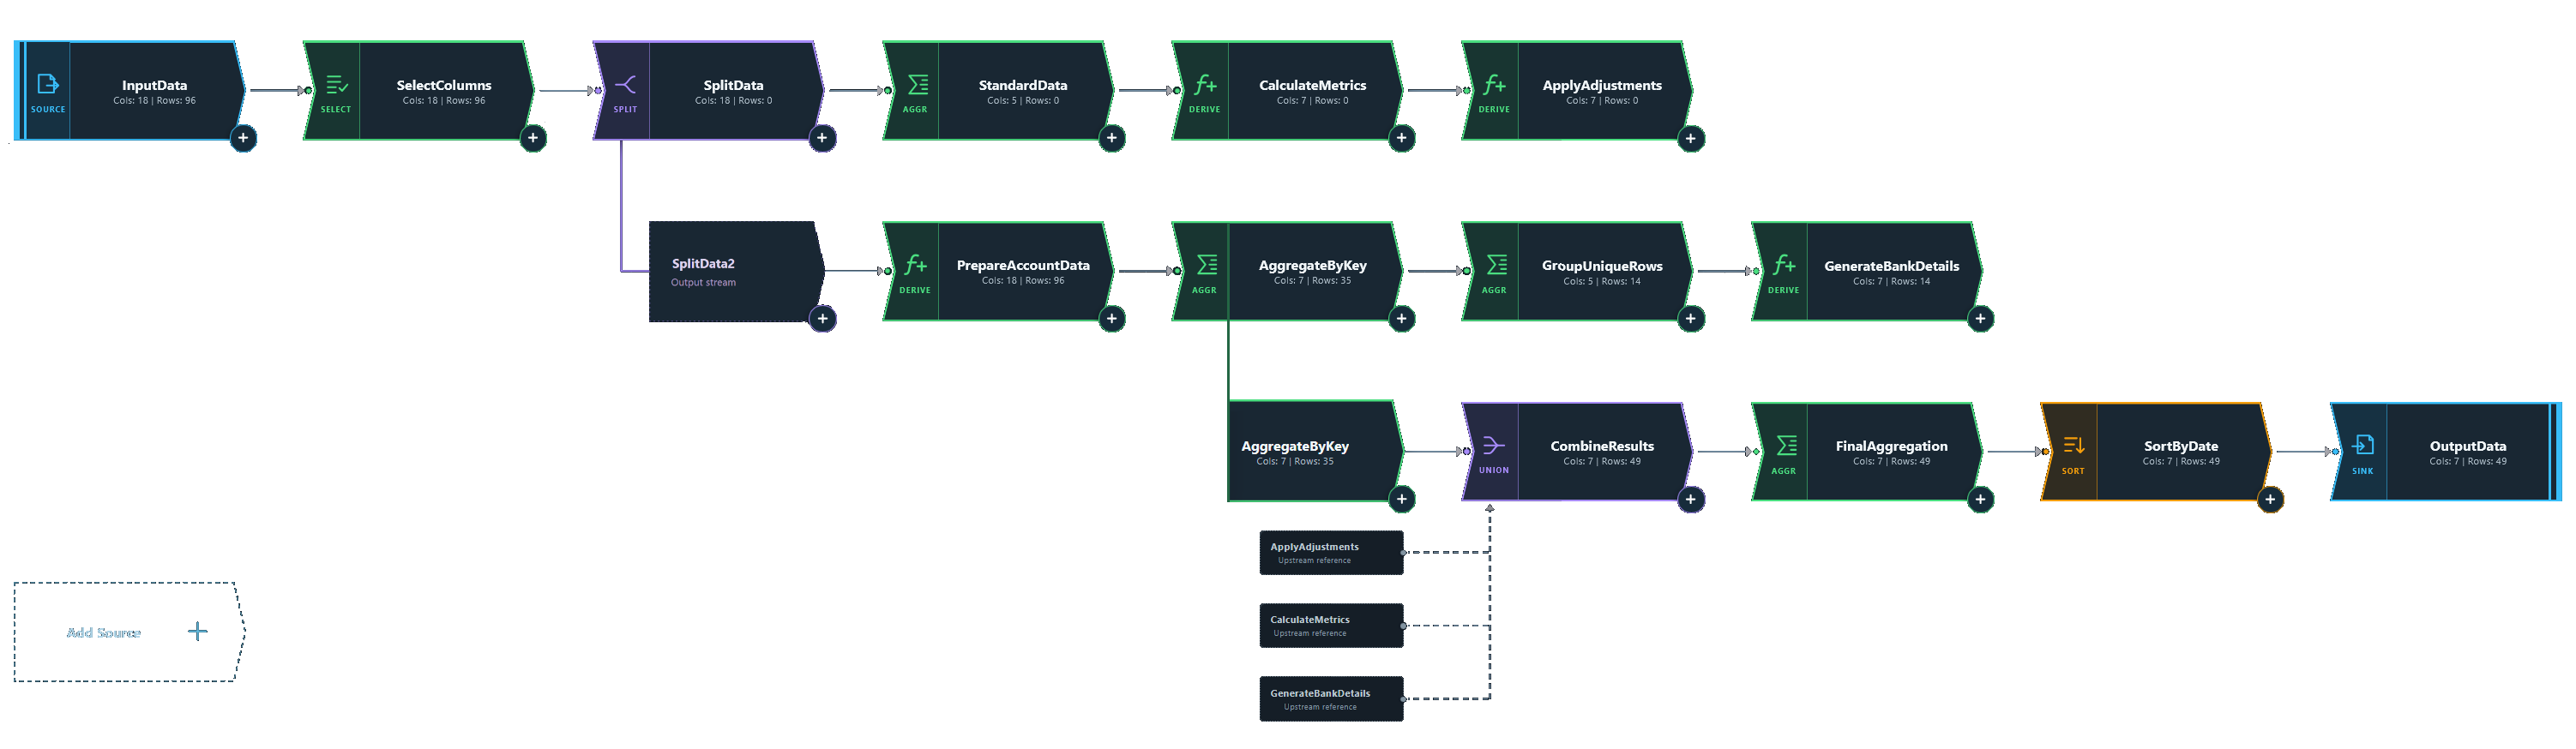
Build, run and understand a dataflow in one local workspace.
A browser-based environment for building, running and debugging Azure Data
Factory (ADF) Mapping Data Flows locally. These visual flows describe how
data is filtered, combined and reshaped. I built it to shorten the wait
between changing a flow and understanding its results.
The workspace combines a familiar graph editor with previews that update
automatically after changes. Transformation View explains how
transformations affect the data. Work is saved locally, and ADF-compatible
import and export keep flows usable in Azure.
I kept the graph layout and activity connections close to ADF’s visual editor,
so existing flows feel familiar. The branching structure makes it easy to follow
the data from input to output while working locally.
THE PROBLEM & THE RESPONSE
A quicker path from Change
Answer
Swipe or use ← → to compare Azure Data Factory and Dataflow Debugger.
Azure Data Factory
Debugging workflow
Checking an activity meant refreshing its preview and waiting
for Azure to return the result. Every change restarted that
cycle. Repeating it across activities made tracing a value
through the flow time-consuming.
Preview
Wait
Change
Repeat
Preview coverage
One activity at a time
Refresh each activity’s preview separately.
Performance
21.64 s / per activity
Median time per activity with a 1,000-row preview limit. At the
average preview time, 29 sequential previews would take
~14 minutes.
Data persistence
Rerun to revisit - ADF Data Preview results are transient.
Revisiting an earlier activity after previewing further
downstream can require rerunning its preview.
Dataflow Debugger
Debugging workflow
After an initial preview, changes propagate through the flow and
affected previews update automatically. I can move between
activities and inspect the results in one local workspace,
without manually refreshing each preview.
Preview
Change
Previews update automatically
Preview coverage
Entire dataflow
Populates every activity’s data preview in a single pass.
Performance
192 ms / whole dataflow
Median time to calculate and propagate all activity previews
across the same 29-activity dataflow, each with a 1,000-row
limit.
Data persistence
Previews persist - Preview data is retained for all activities.
Jump freely between them and inspect the results without
rerunning a data preview.
Transformation View
Data preview only shows the result, transformation view shows how it got
there
Local execution made it easier to try a change. The next step was making
the result easier to understand. Selecting Transformation View displays
the selected activity’s manipulation of the data.
Transformation View in action
Select activity
Shape the columns that leave a transformation
See how source columns map to the output schema. The
visual comparison shows which columns are retained,
renamed or removed before the data moves to the next
activity.
Filter activity
Which rows passed, and why
See the filter condition above the incoming data and
resulting rows. Highlighting identifies rejected records
and reports which predicates failed, so you can
understand exactly what the filter removed and why.
Derived activity
Follow expressions into new and updated values
Compare the original row with the values calculated by a
derived-column expression. See which columns were added
or updated and how the expression uses the incoming data
to produce the result. Updates can affect a whole column
or individual cells, depending on the expression.
Aggregate activity
From source rows to grouped results
Connect a grouped result to every input row that
contributed to it. Highlighting links rows with the same
group key to their output, so you can see how totals and
counts were calculated.
Split activity
Follow rows into their output branches
See how a conditional split routes incoming rows to
different outputs. Branch conditions and matching
highlights connect each input row to its destination,
making it clear which records follow each path.
Sort activity
See how the ordering changes
See how data is reordered by the selected sort columns,
their ascending or descending direction and their
priority. Later sort keys decide the order of rows with
matching values in earlier keys.
Engineering
An editor, execution engine and explanation layer.
React and TypeScript handle the workspace and local engine. The application
parses ADF Data Flow Script, plans the order of dependent activities,
evaluates expressions and runs transformations in the browser.
The production application needs no API for execution or storage. IIS serves
the static files; IndexedDB retains the local workspace. Keeping these
responsibilities in the browser makes the edit–run–inspect loop independent
of an Azure debug session.
Components & relationships
Browser application architecture
IISStatic application hosting
↓ Serves app files to the browser
Your browserLocal execution & storage
Workspace UI
Flow editor
Import, edit and export ADF flows
Transformation View
Display results and their execution lineage
Flow definitionUI to engine
Rows + provenanceEngine to UI
Execution engine
Parser & dependency planner
Build execution order from the flow definition
Local executor
Run transformations; produce rows and provenance together
↕ Workspace save / restore
↑ Row data to the executor
IndexedDBLocal workspace persistence
Local CSV filesInput data for transformations
Explain the execution that actually happened
The executor records which input rows produced each result as it runs.
Transformation View uses that lineage rather than guessing from matching
values, so duplicate values and unmatched join rows can be explained
accurately.
Keep local work compatible with ADF
Import and export preserve ADF resource data while allowing controlled
graph edits. The local workspace supports investigation without making
the flow a separate, incompatible format.
Keep previews usable as data grows
Tables render the visible rows and columns rather than the entire
dataset. Cooperative cancellation prevents stale or cancelled previews
from replacing current results.
Outcome
Less waiting to inspect. More clarity about why.
I can follow an unexpected result back through a flow, test a change and check
its effect while keeping the investigation in one workspace. What began as a way
to reduce preview waiting has become a tool for understanding behaviour: the
evidence behind a result is available alongside the result itself.